Once again we get to look at the economic data CCP publishes each month. August marked the first full month of the current null sec war. Also, we get to look back at the first full month of Blackout in August 2019. With the latest dev blog on resource redistribution, a look back at August will also give some idea what the end of the Scarcity Phase looks like.
 |
| From August 2020 MER |
As usual, we need to take a look at New Eden's money supply. During the course of August, the amount of ISK in the game increased by 1.4%, or 18.5 trillion. From 1 January to 31 August, the money supply increased by 70.6 trillion ISK, or 5.6%. In perhaps a sign of the effect of the current null sec war, the Active ISK Delta only decreased by 15.3 trillion ISK during a time players traditionally log off to do other things. Last year at this time, with Blackout in effect, the Active ISK Delta decreased by 43.1 trillion ISK.
To support the idea of greater activity, the value of the destruction outside of wormhole space increased to 38.5 trillion ISK. Perhaps counter-intuitively, only 25% of the increase occurred in null security space, despite the ongoing fighting between the major powers. Also, compared to a year ago, the value of destruction is down by 3% in all of known space and 3.2% in null security space.
In EVE, destruction is supposed to lead to production. Overall, the value of the items produced dropped by 13.3% from 140 trillion ISK in July down to 124.4 trillion ISK in August. The cause of the decrease was production activity returning to normal levels in null sec. The 16.5% drop in the value of production in August follows the 22.6% increase in production value in July 2020. Year-over-year, production value in known space fell by 6% in known space. On a positive note, production value in null sec increased by 5.1% over the same period.
For the second month in a row, the value of the ore mined increased in New Eden. Since June, the monthly value of the ore mined increased by 27.5% in known space (6.6 trillion ISK) and 36.8% (4.3 trillion ISK) in null sec. One of the great questions about mining, though, is the physical volume of ore mined. The monthly economic reports only provide the value of the ore mined.
One constant over the last few months is the amount of bounties collected by players. With well over 90% of bounties collected in null sec, some might figure the null sec war would result in a reduction. The truth is something different, as seen below.
The NPC bounties collected is the biggest difference between the Blackout month of August 2019 and the first full month of the null sec war of 2020. Year-over-year, the value of the bounties collected in null sec tripled, from 15.8 trillion ISK to 49 trillion ISK.
A statistic I track is the value of goods that make up the four indicies in the monthly economic report: Consumer Price Index, Primary Producer Price Index, Secondary Producer Price Index, and Mining Price Index. The value of the indices fell another 4.4% in August, from 498.3 trillion ISK in July down to 476.3 trillion ISK in August. Year-over-year, the value of the four indices has fallen by 21.4%. Economic output is at its lowest point since the post-Blackout month of October 2019.
As I've noted in the past, the New Eden economy is consumer-driven, with the value of goods in the CPI making up 78% of the indices total. The value of the CPI fell another 5% in August and is down 21.6% since August 2019.
 |
| The 4 economic indices from the August 2020 MER |
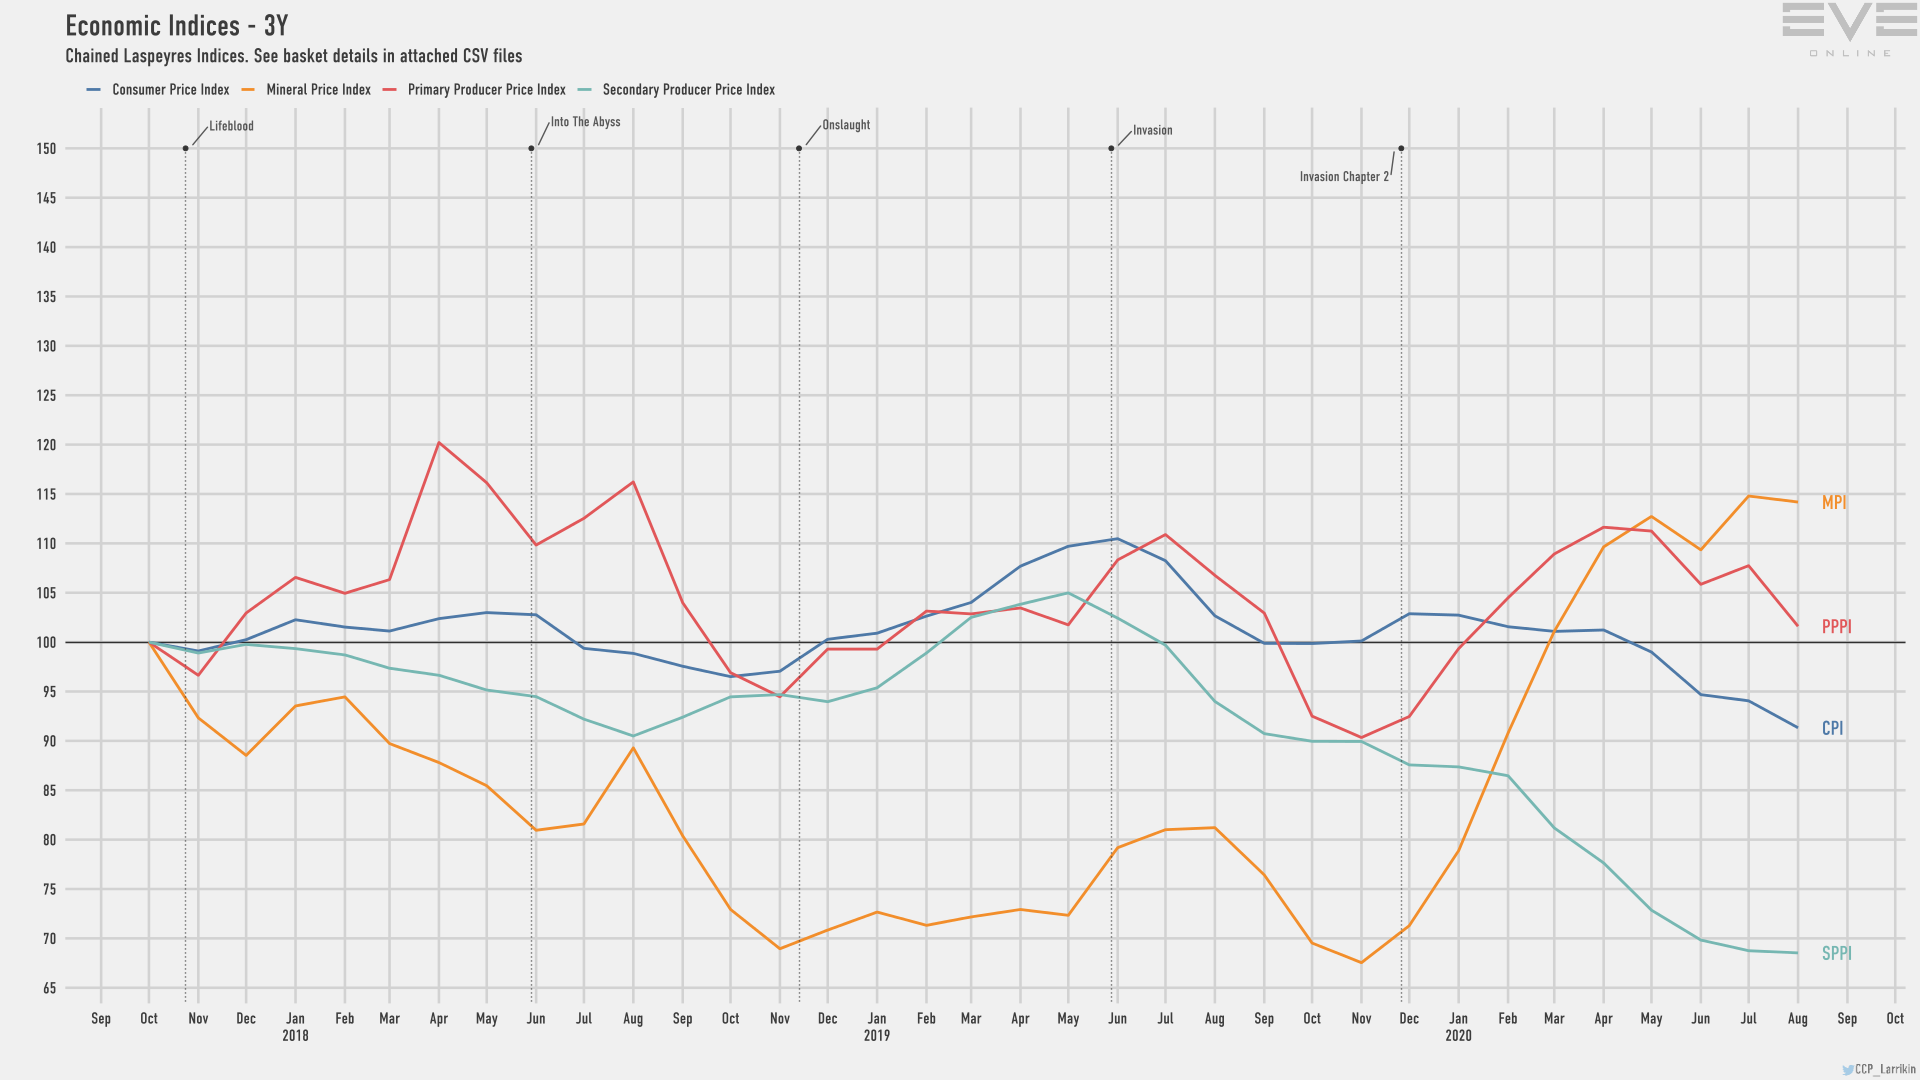
At this point, I think a look at the indices graph from the MER is in order. The Total Economy and Consumer Price Index graphs above only look at the value of the goods in the baskets for each index. They do not factor in changes in prices. So, if activity is stable, and the prices are decreasing, the value of an index should also decrease.
In the U.S. and many other countries, the change in the Consumer Price Index is a main measurement of inflation. Until told otherwise by CCP, I'll continue to assume the same holds true in the New Eden economy. The website Investopedia defines
the consumer price index as follows:
The Consumer Price Index (CPI) is a measure that examines the weighted average of prices of a basket of consumer goods and services, such as transportation, food, and medical care. It is calculated by taking price changes for each item in the predetermined basket of goods and averaging them. Changes in the CPI are used to assess price changes associated with the cost of living. The CPI is one of the most frequently used statistics for identifying periods of inflation or deflation.
Apart from the Mineral Price Index, the indices show a long term deflationary trend. The CPI has declined every month since January 2020. The Primary Producer Price Index began its decline in May 2020. And the Secondary Producer Price Index has steadily declined since May 2019.
I have to admit, I let the upcoming
mineral distribution changes color how I looked at the MER this month. Was the economy shrinking due to less activity or deflation? I think the answer is a mix of the two. I also have to bring up the changes to mark August as the final month of relative sanity for the next few months. I don't know how much the buying frenzy following the dev blog will affect the valuations in the economy in September, much less how the change will impact the October MER. I do know that keeping up to date on the information in the monthly economic reports will wind up clarifying what is happening in
EVE Online.


No comments:
Post a Comment